Measure AI impact on engineering by delivery, not activity
To measure AI impact on engineering, track lead time and change failure rate against your own baseline. A plan for teams of 20 to 150 engineers.

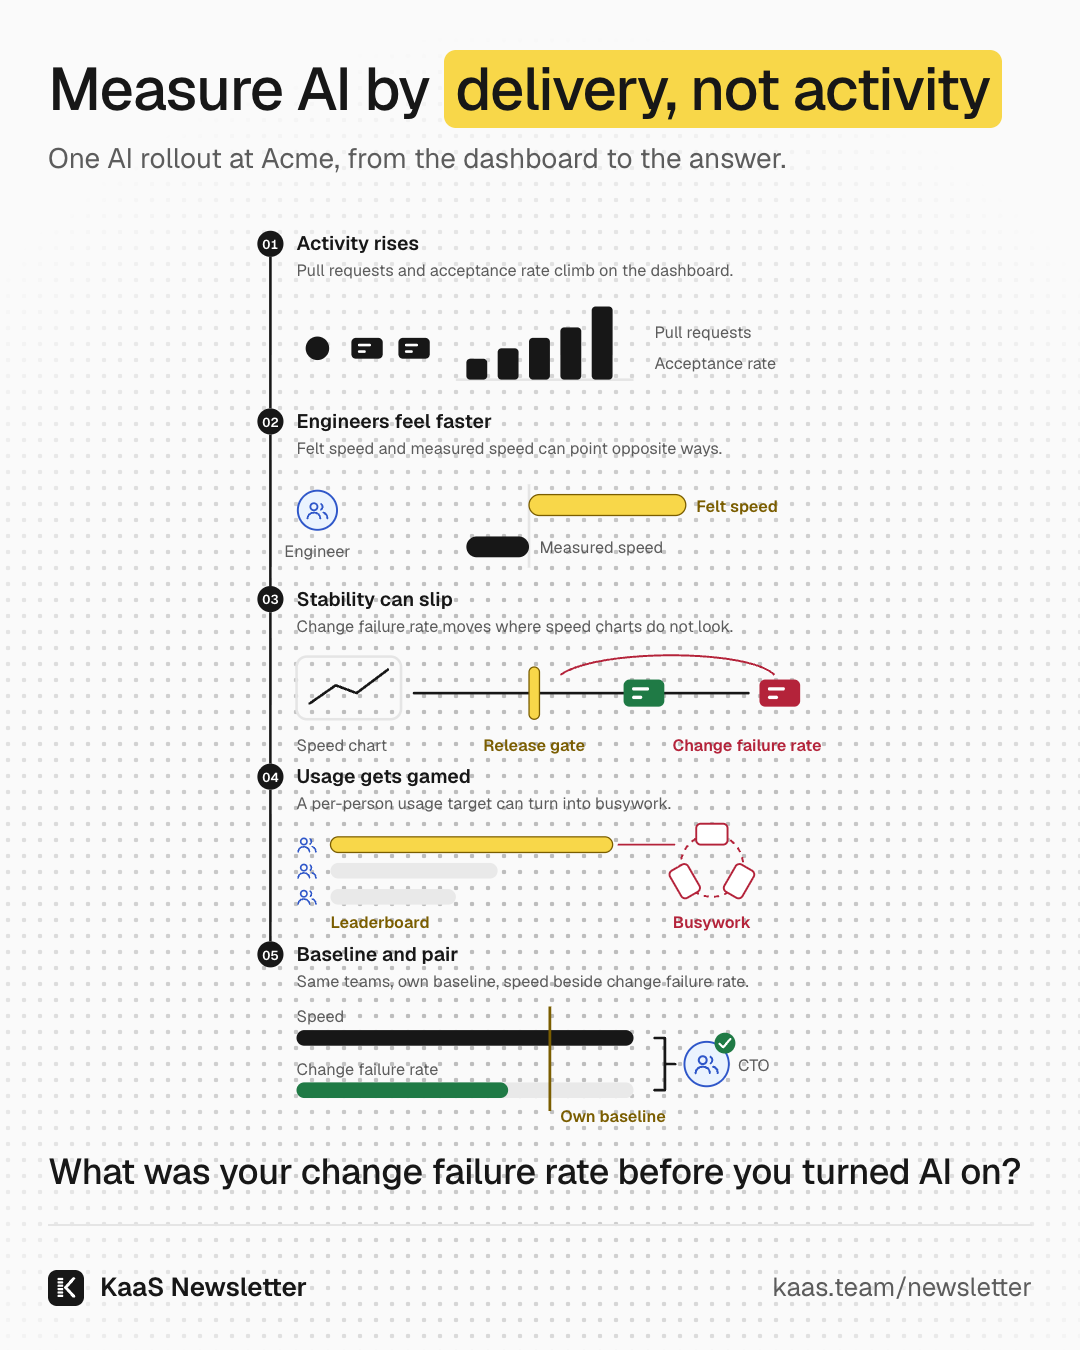
Measure AI by delivery, not activity
One AI rollout at Acme, from the dashboard to the answer.
What was your change failure rate before you turned AI on?
KaaS Newsletterkaas.team/newsletter
Your CEO asks whether AI is making engineering faster. The dashboard shows more pull requests than last quarter and a high suggestion acceptance rate. Is that a yes?
In METR's 2025 randomized trial, experienced open-source developers took 19% longer to finish real tasks when they could use AI1. Afterwards, they still believed AI had sped them up by 20%1. METR limits the result to one setting and early-2025 tools1, so what carries over is the gap between felt and measured speed.
AI reliably raises activity and felt speed can mislead, so our advice is to baseline lead time and change failure rate first and compare the same teams over months. We start from your own baseline because DORA finds AI amplifies what a team already has2.
We follow one change at Acme Inc to show how. Last quarter Acme rolled out coding agents to its engineering teams, and now the CEO's question has landed on the CTO's desk: is it working? Acme has no data team, and the vendor dashboard is its only report.
AI raises activity reliably, and activity is not delivery
AI reliably raises the things you can count at a developer's desk. Cui and colleagues gave a coding assistant to 4,867 developers at Microsoft, Accenture and a third large company, at random, and pooled the three experiments3. Pull requests, commits and builds all went up; the one quality measure they tracked, the share of builds that succeeded, did not.
- Pull requests+26.08%
- Commits+13.55%
- Builds+38.38%
The authors read the builds number less kindly themselves: more builds may mean more trial and error3. The error bars are wide, and the gains were bigger for less experienced developers. None of these units is a deploy, a lead time or a failure rate.
At company level, the gains can disappear. Faros AI, an engineering analytics vendor, found in its telemetry that teams with high AI adoption closed more tasks and merged far more pull requests. Company-level throughput, DORA metrics and quality did not move4. That is observational data from a company that sells measurement, and still the clearest sign we found that team activity and company delivery come apart.
DORA's four delivery metrics are the yardstick here. Lead time for changes is how long a commit takes to reach production, and deploy frequency is how often you ship. Change failure rate is the share of deploys that cause a failure, and recovery time is how fast you restore service. No controlled study we found measures lead time, deploys or recovery directly, so the case for measuring your own is strong.
Large companies with platform teams of their own have the same gap. Suhail Patel leads platform teams at Monzo and says plainly what his numbers cover.
The 'objective' numbers we measure are about usage and local performance.
Farhan Thawar, Shopify's head of engineering, says code is cheap now and what he wants is solutions6. At Acme, the dashboard after one quarter shows more pull requests and a high suggestion acceptance rate. Both are activity, and neither says whether a customer got anything sooner.
Felt speed can mislead, so a survey cannot answer alone
Engineers can feel faster while measuring slower. In METR's trial, developers expected AI to make them 24% faster, were measured 19% slower, and still believed afterwards that they had been 20% faster111.
slower, as measured Faster as the same developers believed afterwards
The same people, on the same work, felt one thing and did another.
The controlled trials do not agree on direction. A trial inside Google found about 21% faster on one set task7, and METR's late-2025 follow-up could not rule out no effect at all8. METR adds that some developers now decline to join because they do not wish to work without AI, which it thinks biases its estimate downward8. Our read: felt speed is a poor guide to delivered speed, so it needs a measurement beside it.
Patel gives an honest estimate of his own for migrations at Monzo.
It feels like we’re saving 40-60% of the previous effort of migrations with these tools.
A survey captures that kind of answer, and it is worth having beside the system numbers. Acme runs a survey, and most engineers say they are faster. The CTO keeps the survey, because time saved is worth knowing, but will not report it alone: in METR's trial even experienced developers could not tell.
Speed gains can hide in stability, so pair speed with failure rate
A speed number alone can hide the cost, because in DORA's survey models delivery stability fell as AI adoption rose. In 2024, throughput dipped slightly and stability fell further9.
7.2% lower delivery stability as AI adoption rose
1.5% lower delivery throughput
A year later the throughput link turned positive, while the stability link stayed negative2. Both are correlational survey models, so they show direction and leave cause open. In both years stability went down, and stability is the metric a speed dashboard leaves out.
Uplevel, a vendor that sells engineering analytics, compared developers with and without an AI assistant. The assisted group introduced 41% more bugs, with no significant gain in cycle time or throughput10. Read with DORA, our view is that a speed number reported alone hides the cost these studies keep finding.
Laura Tacho is CTO of DX, a company that sells AI measurement. Writing with Gergely Orosz, she describes what most of the companies they studied have settled on.
almost every single company is tracking Change Failure Rate alongside a measure of speed like PR throughput.
At Acme, pull requests are up, and Acme has had rollbacks this quarter. Without last year's change failure rate, the CTO cannot say whether that is new. From here on, Acme reports speed only next to failure.
Usage numbers are easy to game, and so is any target
Raw usage is the easiest number to game, and any number turns gameable once it becomes a target. DORA warns that token count measures only input and is incredibly easy to game11. It says the same of its own delivery metrics: turned into broad targets, they make teams likely to game them12.
DX left suggestion acceptance rate out of its framework on purpose, Tacho says13. She also rejects lines of AI-generated code as a way to measure impact13. DORA's guardrail on usage counts is blunter still.
is DORA's word for individual usage scores, and it calls company-wide aggregates meaningless
In 2023 Kent Beck and Gergely Orosz wrote that the act of measurement changes how developers work14. Surveys are no exception, and Beck remembers what happened at Facebook once scores fed evaluations.
Give me a 5 & I'll make sure you get an 'exceeds expectations'.
Acme's survey stays useful only while nobody's rating depends on it. Usage tracking still has a use: the same DORA essay grants that a token leaderboard is a relatively low-stakes way to encourage exploration among AI-hesitant developers11. Our read is that the line runs for learning, never as a target.
At Acme, someone proposes a usage leaderboard for each engineer. The CTO reads usage per team instead, uses it only to find the teams that need help getting started, and keeps it out of performance reviews.
Measure the same teams against their own baseline, over months
Write down where each team stands now, change one thing, and compare the same teams with themselves months later. No source we found gives a setup for a team of 20 to 150 engineers without a data team. This plan is our assembly of DX's advice and DORA's metrics, and we have not watched a company your size run it.
DX's framework measures three things together: utilization, impact and cost15. It advises waiting through a learning curve of three to six months before drawing conclusions16. Compare team by team, and check that the result holds in the company total too, where Faros AI saw team gains disappear4.
You do not need a data team for the numbers. Our method: lead time comes from merge and deploy timestamps in your CI, and change failure rate is rollbacks and hotfixes divided by deploys. The order matters more than the tooling, and Tacho names the first step.
Start with solid baseline measurements if you want to do comparisons well.
Large companies run the comparison with cohorts. Dropbox tracks pull request throughput for each engineer and reports that engineers who engage more with AI tools have an outsized impact on the code shipped17. It publishes no numbers, and heavier users may simply be stronger engineers, so read it as the shape of the comparison and nothing more.
- Baselinetoday's lead time, deploy frequency and change failure rate, team by teamCTO
- Next changethe payments team gets agents firstEngineering manager
- Comparisonunchanged, so the before and after has something to read againstOther teams gate
- Reviewlead time and change failure rate, as a pair, three to six months laterCTO
Acme cannot recover a clean baseline for last quarter's rollout, so it writes down where it stands today. It sends the next AI change, agents on the payments backlog, to one team first and keeps the rest as the comparison. At the review date the CTO answers with a pair: lead time and change failure rate, for the same teams, before and after.
AI made the cheapest step cheaper, and delivery happens downstream
AI makes typing, the cheapest step, cheaper, and delivery is decided downstream in review, testing, release and recovery. A team's output is what reaches customers safely. Our read is that numbers measured at the typing step, whether suggestions, lines or pull requests, tend to rise for that reason alone3.
We think that is why DORA's 2025 report finds that AI amplifies what a team already has2. The only honest measure sits at the end of the chain, compared with where the same team stood before.
At Acme, the CTO can now answer for the next change with a pair of delivery numbers. For last quarter's rollout, the CTO tells the CEO it can only be measured from today forward. Once you can measure it, the next question is how to make it move: small changes, strong tests and fast review decide whether those numbers go up.
What to do on Monday
- Write down the baseline. Write down your lead time, deploy frequency and change failure rate, team by team. If AI is already in use, today's numbers are the baseline for the next change.
- Pair every speed number. Report pull request throughput or lead time only next to change failure rate.
- Read usage per team. Use it to find who needs help getting started, never as a per-person score or a target.
- Keep the survey, never alone. Ask for time saved, and read it beside the system numbers.
- Set the review date. Three to six months after the next AI change, compare the same teams against their own baseline.
The companion, The AI ROI playbook, is free with your work email.
What was your change failure rate before you turned AI on?
Param
Sources
- METR, Measuring the Impact of Early-2025 AI on Experienced Open-Source Developer Productivity, 2025
- Google Cloud, Announcing the 2025 DORA report, 2025
- Cui, Demirer, Jaffe, Musolff, Peng, Salz, The Effects of Generative AI on High-Skilled Work: Evidence from Three Field Experiments with Software Developers (working paper, Feb 2025; later Management Science), 2025
- Faros AI, The AI Productivity Paradox Report, 2025
- The Pragmatic Engineer, How tech companies measure the impact of AI on software development, 2025
- Bessemer Venture Partners Atlas, Inside Shopify's AI-first engineering playbook, 2026
- Paradis et al., How much does AI impact development speed? An enterprise-based randomized controlled trial (arXiv 2410.12944), 2024
- METR, uplift study update, 2026
- Google Cloud, Announcing the 2024 DORA report, 2024
- Uplevel, Can GenAI Actually Improve Developer Productivity?, 2024
- DORA, Finding balance in the era of tokenmaxxing, 2026
- DORA, DORA's software delivery performance metrics (guide), 2026
- The Pragmatic Engineer podcast, Measuring the impact of AI on software engineering, 2025
- The Pragmatic Engineer, Measuring developer productivity? A response to McKinsey, 2023
- DX Research: Measuring AI code assistants and agents, 2025
- DX blog: How to measure AI impact, 2026
- Dropbox Tech, Insights from our executive roundtable on AI and engineering productivity, 2026